Session Metrics
Session metrics provide critical insight into your session's activity, allowing you to monitor usage and debug performance bottlenecks. The Session Metrics view shows exactly what your training and sampling traffic did over time, including throughput, training utilization, and in-flight requests. You can read the summary panels in the console to track general resource utilization, or export the full timeline to Perfetto for a detailed, per-request view.
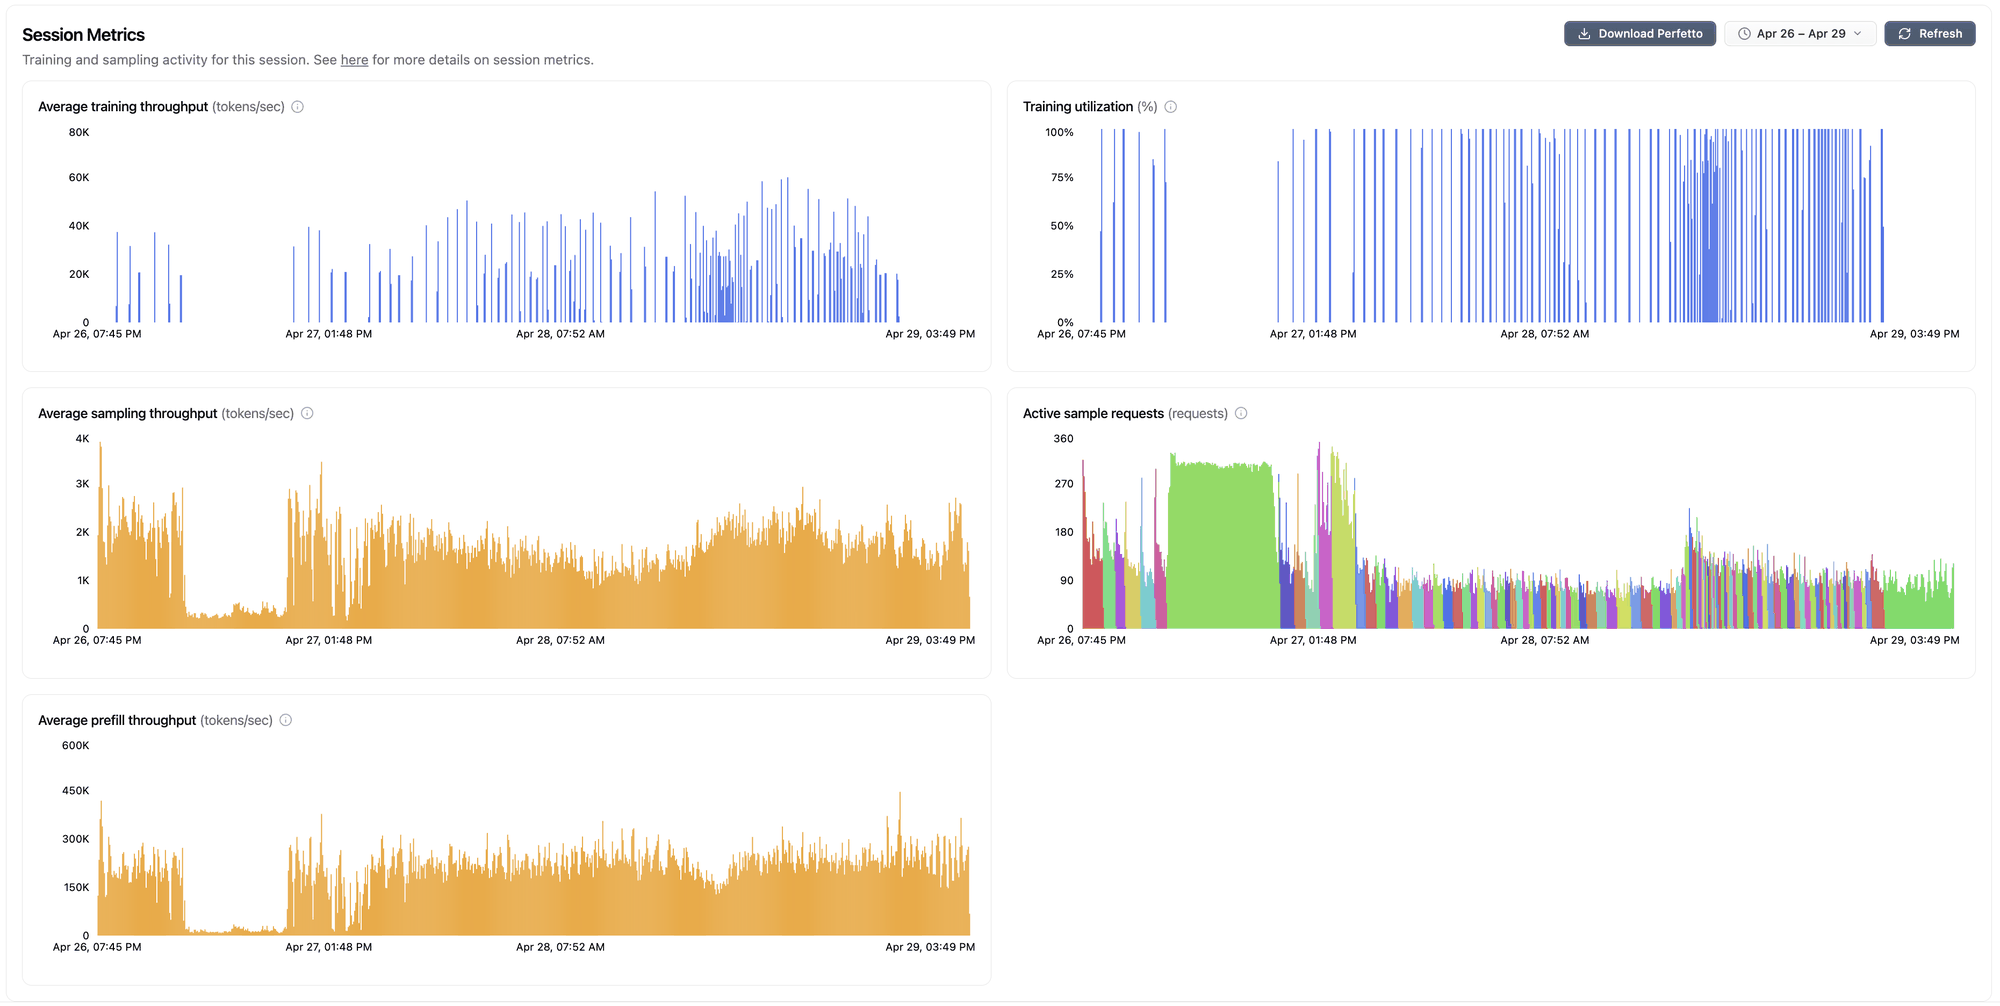
The Session Metrics view in the console.
The console panels are a subset of the trace: In-flight sample requests (the console's "Active sample requests"), Training utilization, and the Training, Generation, and Prefill tokens/sec rates. The exported Perfetto trace is a strict superset, adding per-request sizes, latency percentiles, totals, rate-limit events, and the individual request spans.
Exporting and viewing the trace
Viewing the trace in the browser
For the full picture, every request and counter at fine resolution, export a Perfetto trace:
- Click Download Perfetto on the session page (large sessions take a moment to build).
- Open ui.perfetto.dev.
- Drag the
.pftracein, or use Open trace file.
Counter tracks run along the top (grouped: Concurrency, Throughput, Per Request, Latency, Totals); below them, each training and sampling request is a clickable slice on its lane.
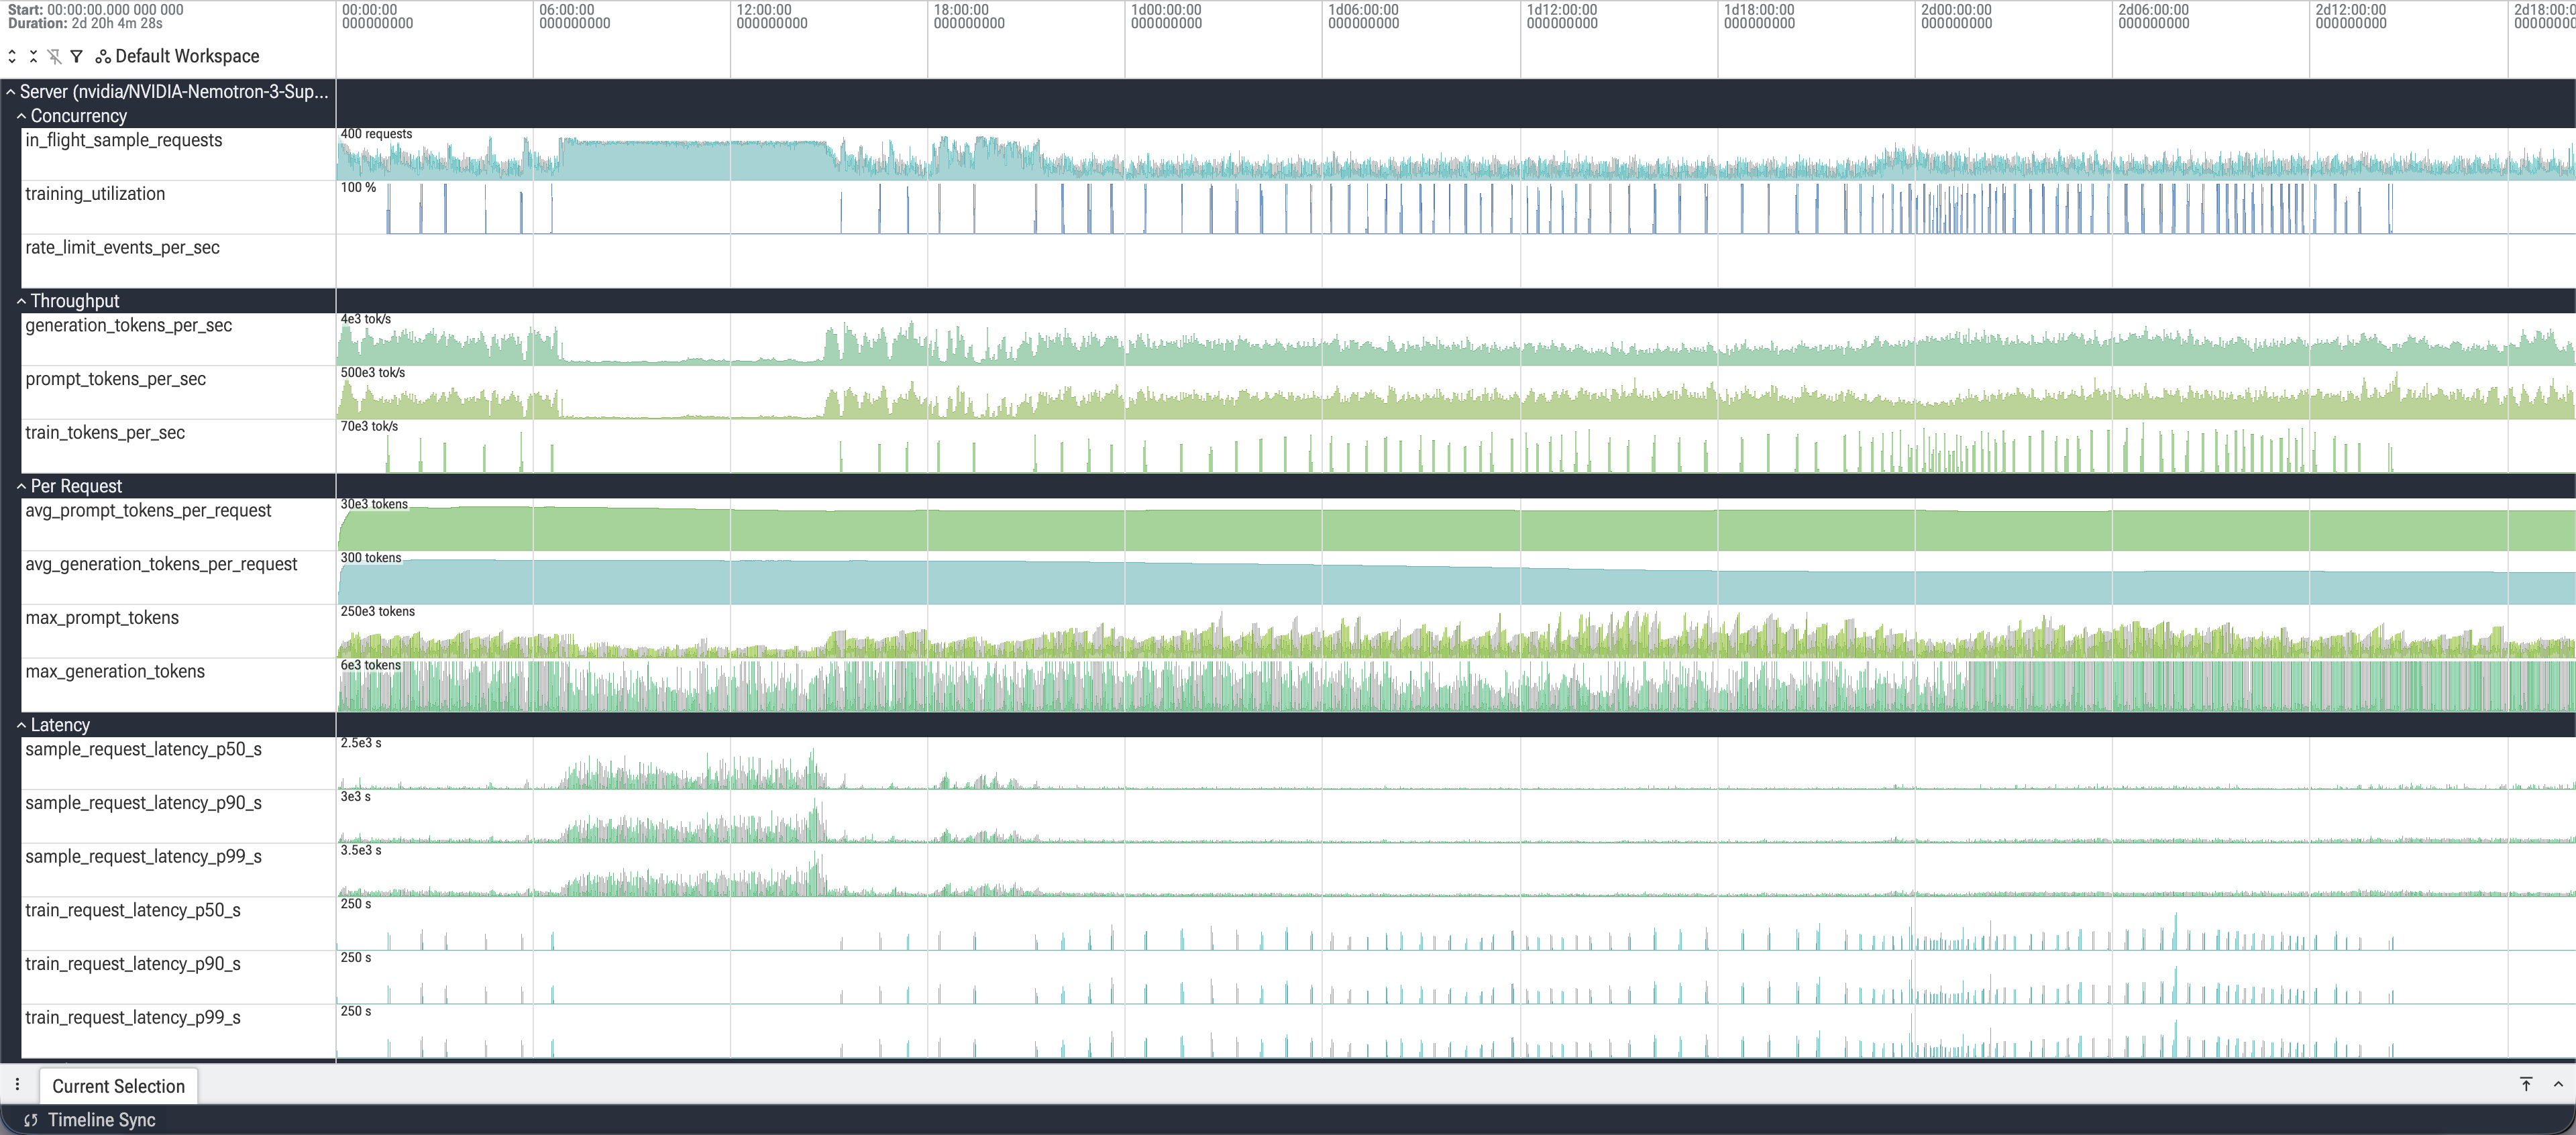
An example exported trace
New to Perfetto?
A general-purpose trace viewer; see the official Perfetto UI guide for the full tour. Essentials:
- Zoom/pan:
W/Szoom,A/Dpan (orShift+drag,Ctrl+wheel). - Click a slice for its details;
,and.step between slices. - Drag a time range for aggregate stats over it.
- Find a track:
Ctrl+P(Cmd+Shift+Pon Mac).
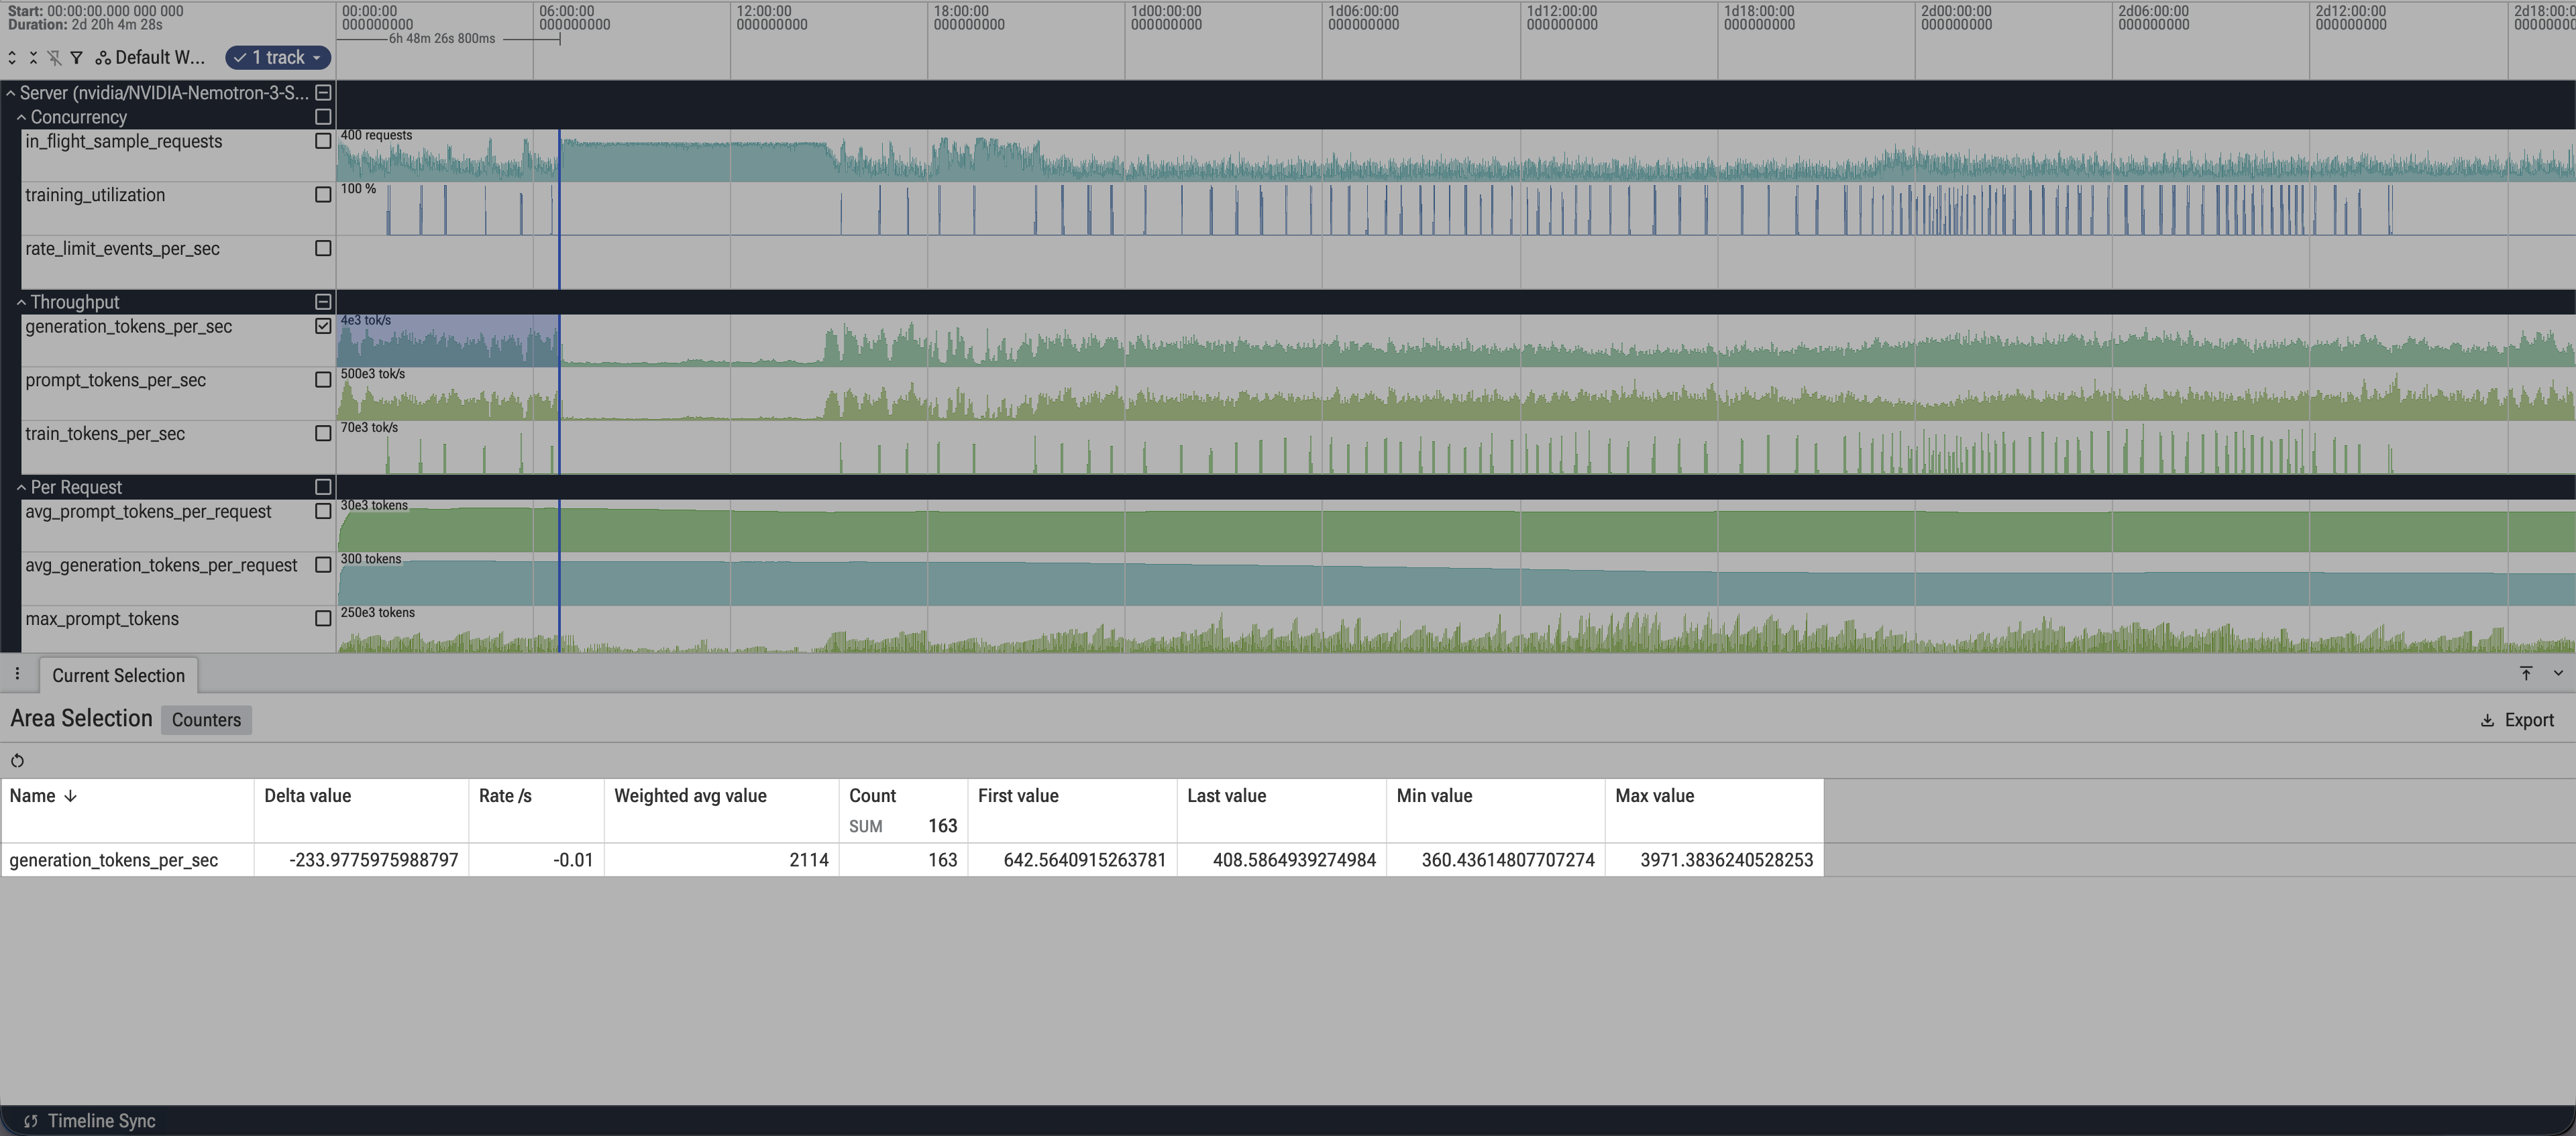
Aggregate stats for a selected time range
Exporting the trace programmatically
You can also export the trace without the console, which is handy for scripts and coding agents:
- CLI:
tinker session export-tracedownloads the trace to a local file (or prints a signed download URL with--url-only): - Python:
RestClient.export_session_trace()returns a signed download URL for the.pftrace(no auth headers needed to fetch it; the URL expires after about an hour):
Either way, the server builds the trace once and reuses it: re-exporting picks up new activity, and an up-to-date trace is returned instantly.
Analyzing the trace with a coding agent
The .pftrace file is queryable with PerfettoSQL via Perfetto's Trace Processor, and coding agents are good at writing these queries. Instead of (or in addition to) inspecting the timeline yourself, you can have an agent export the trace with the CLI and analyze it directly:
from perfetto.trace_processor import TraceProcessor

tp = TraceProcessor(trace="session-id.pftrace")
df = tp.query("select name, dur from slice order by dur desc limit 20").as_pandas_dataframe()
Useful things to ask an agent to look for:
- Bottlenecks in your client or environment: gaps between sample request slices (the sampler idling while your code computes rewards or builds prompts), long tails in request latency, or low In-flight sample requests while throughput is below what the model can serve.
- Concurrency tuning to maximize token throughput: whether Generation tokens/sec still rises with In-flight sample requests (if so, submitting more concurrent requests will likely lift throughput), and how the checkpoint mix in flight changes around weight updates.
Since the export works end to end from the command line, an agent can run the whole loop itself: export the trace, query it, and report back with concrete suggestions.
Metric Details
Concurrency
- In-flight sample requests (
requests): sampling requests running at each moment (the console's "Active sample requests"). Split by weights version: each colored band is a different generation (e.g. a newer checkpoint), stacking to the total, so you see the checkpoint mix in flight. - Training utilization (
%): the percentage of wall-clock time the trainer was actively running forward/backward steps in each interval. Intervals are 1 minute long in Perfetto and can be longer in the console. It will not always be 100%; treat any value above 0% as a sign that training work was happening in that interval. - Rate-limit events/sec (
events/s): how often the session hit a rate or capacity limit, per second.
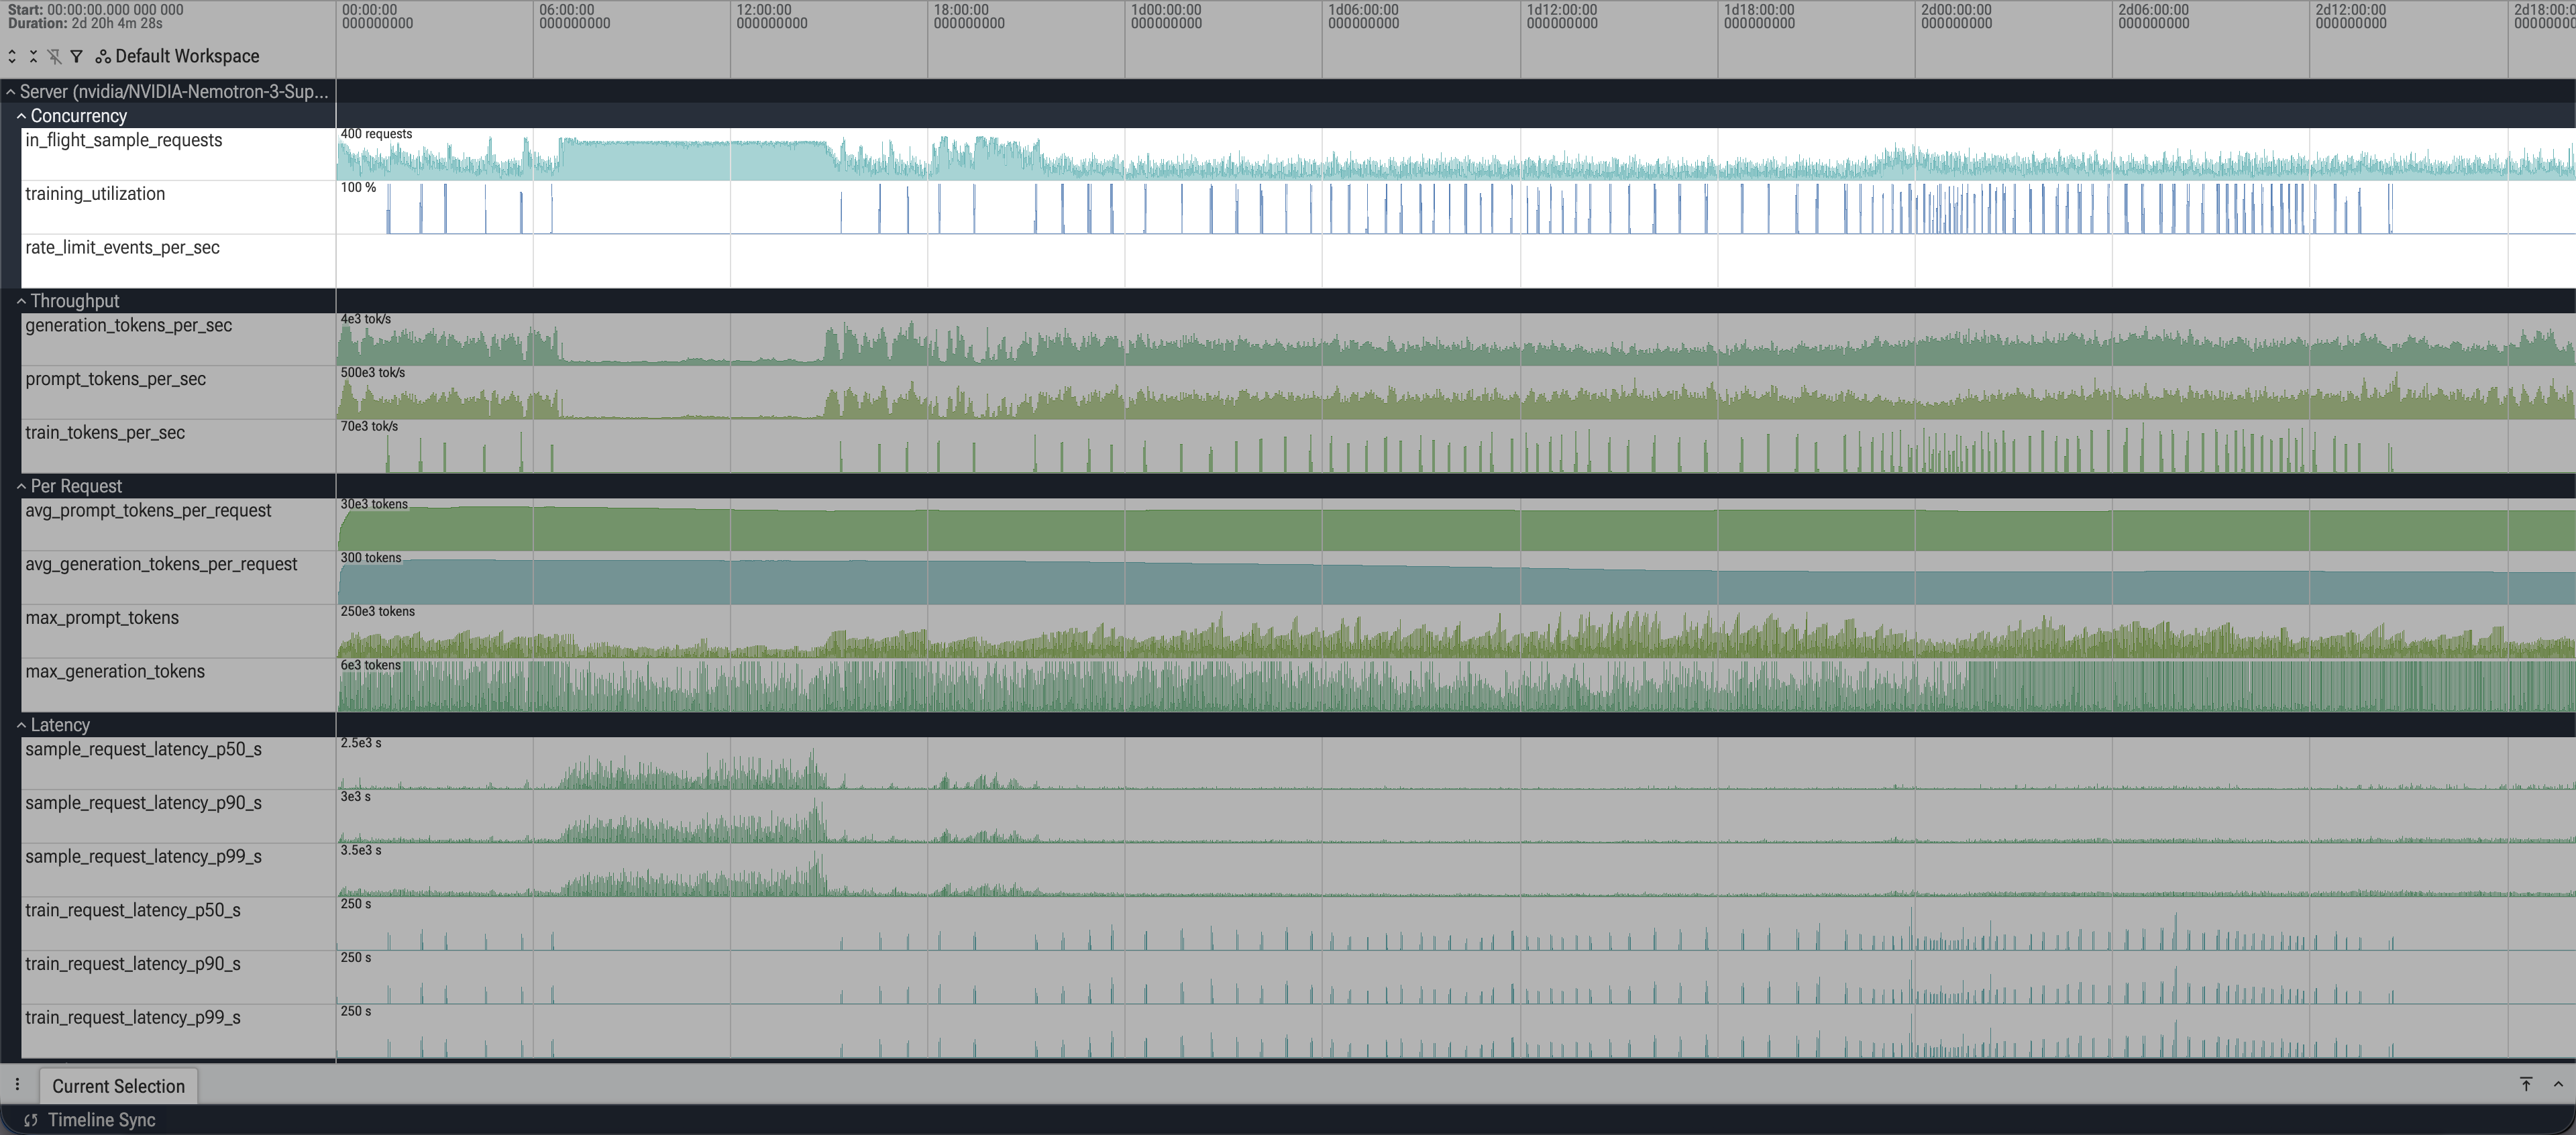
The Concurrency counter tracks
Throughput
- Training tokens/sec and Generation tokens/sec (
tok/s): total training and generated tokens per second. Each request's tokens are spread evenly across the time that request was active (from when it started running to when it finished), instead of being credited all at completion, so a long request reads as a steady rate over its lifetime rather than a spike at the end. Note that because of this, these numbers are an estimate. Intervals are 2.5 minutes long in Perfetto and can be longer in the console. - Prefill (prompt) tokens/sec (
tok/s): total prompt tokens per second, credited at the moment each request starts, because prefill is a burst of work at the very beginning of a request. Note that because of this, these numbers are an estimate.
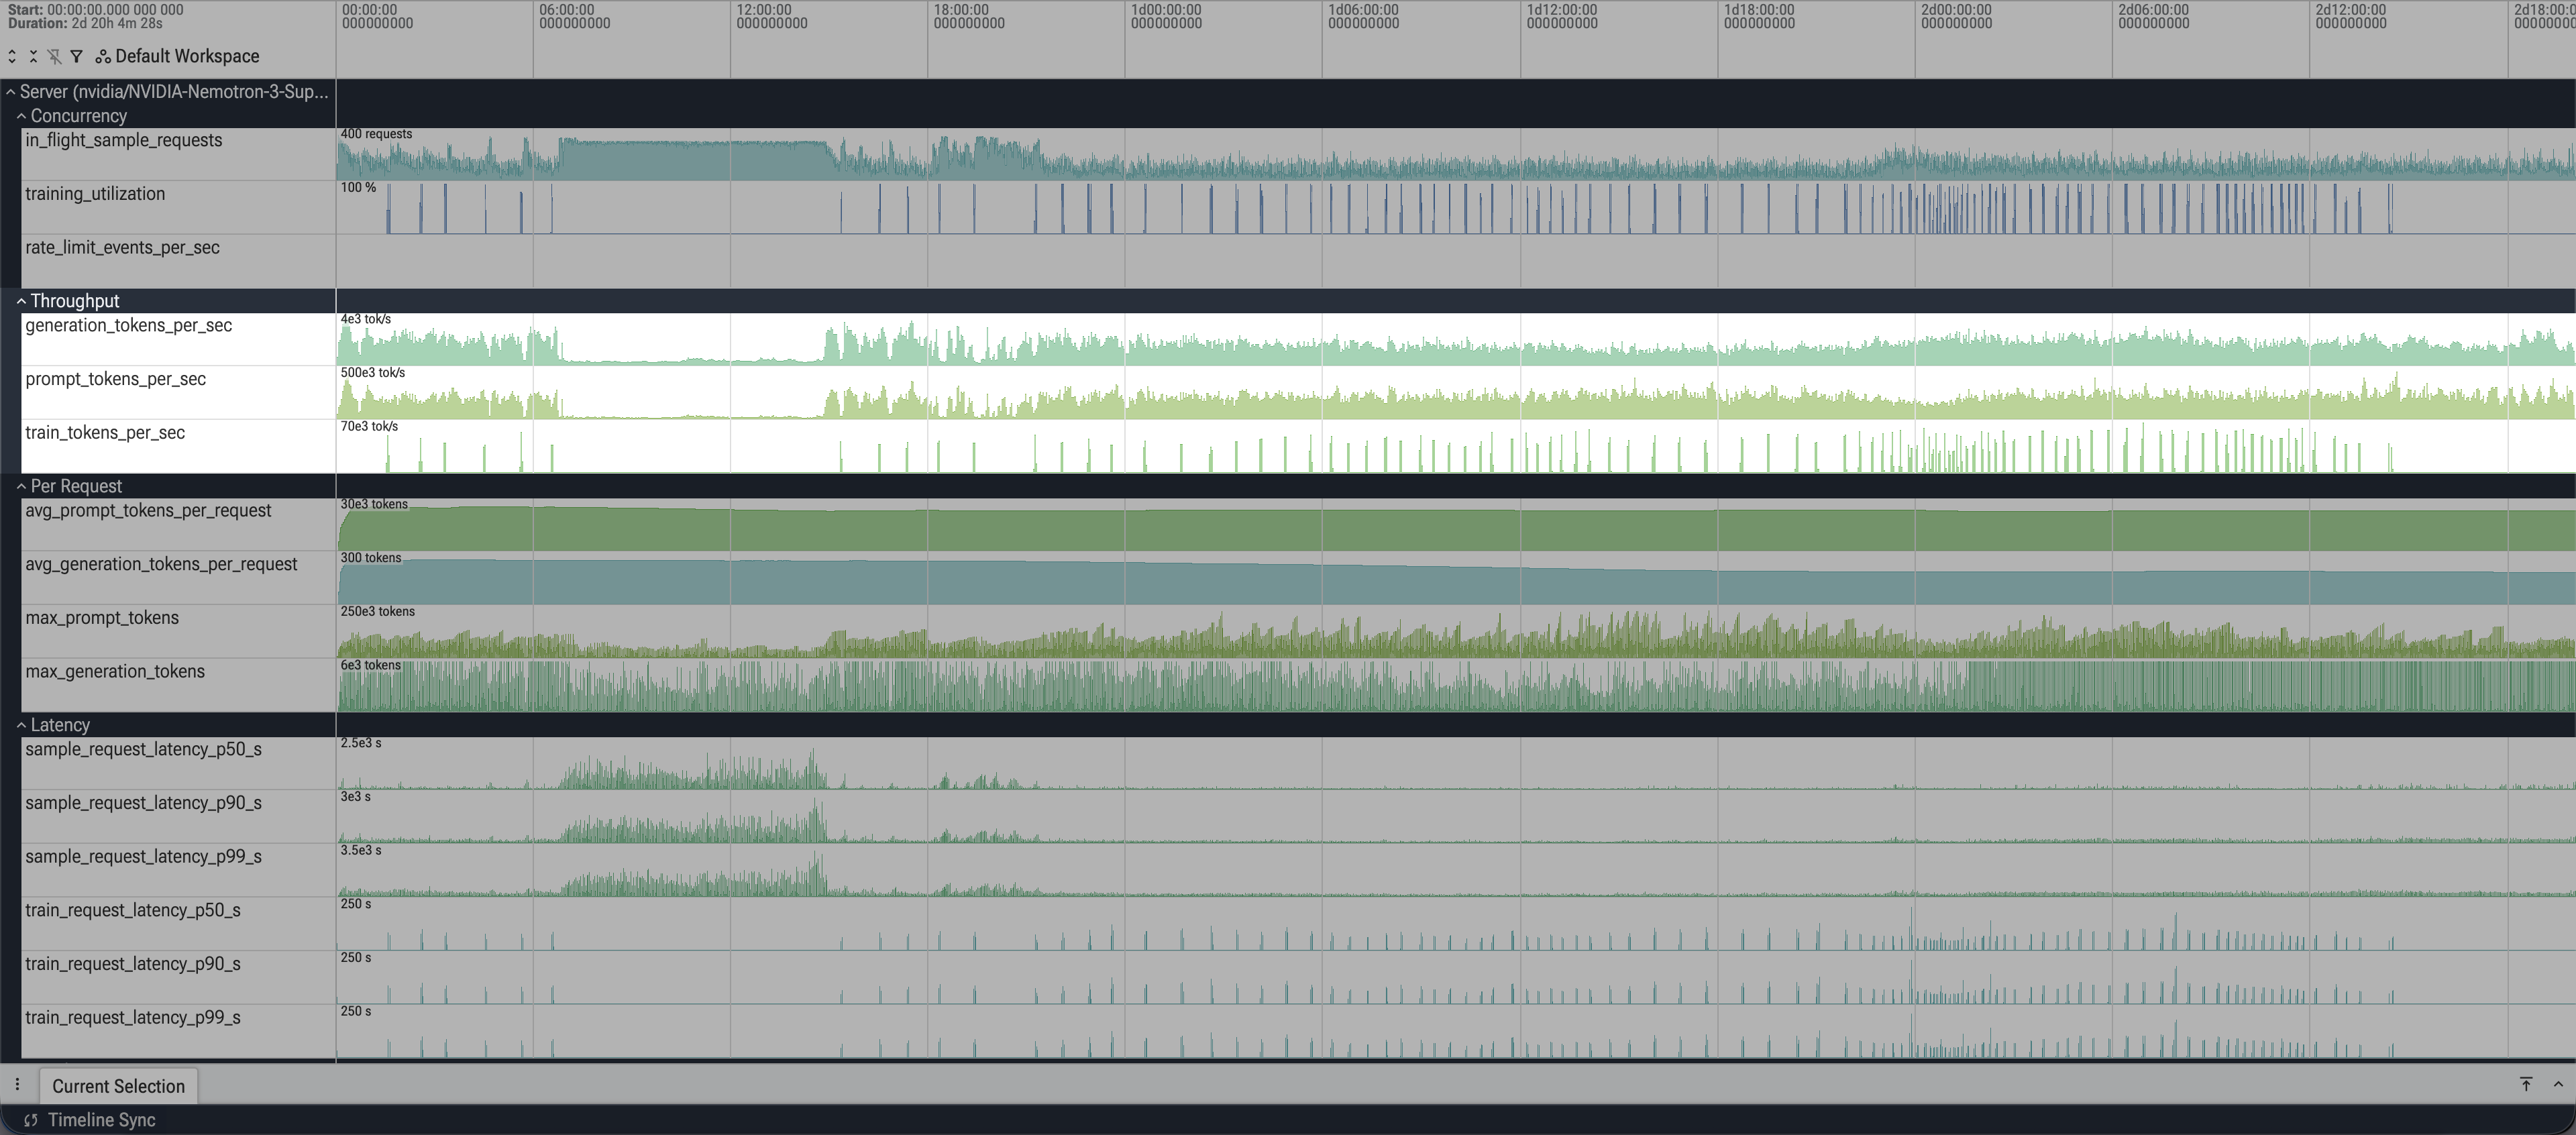
The Throughput counter tracks
Per Request
- Avg prompt tokens/request and Avg generation tokens/request (
tokens): cumulative average size across all sample requests completed so far, so it settles toward the session-wide average. - Max prompt tokens and Max generation tokens (
tokens): largest single prompt and generation in each 1-second interval (outliers).
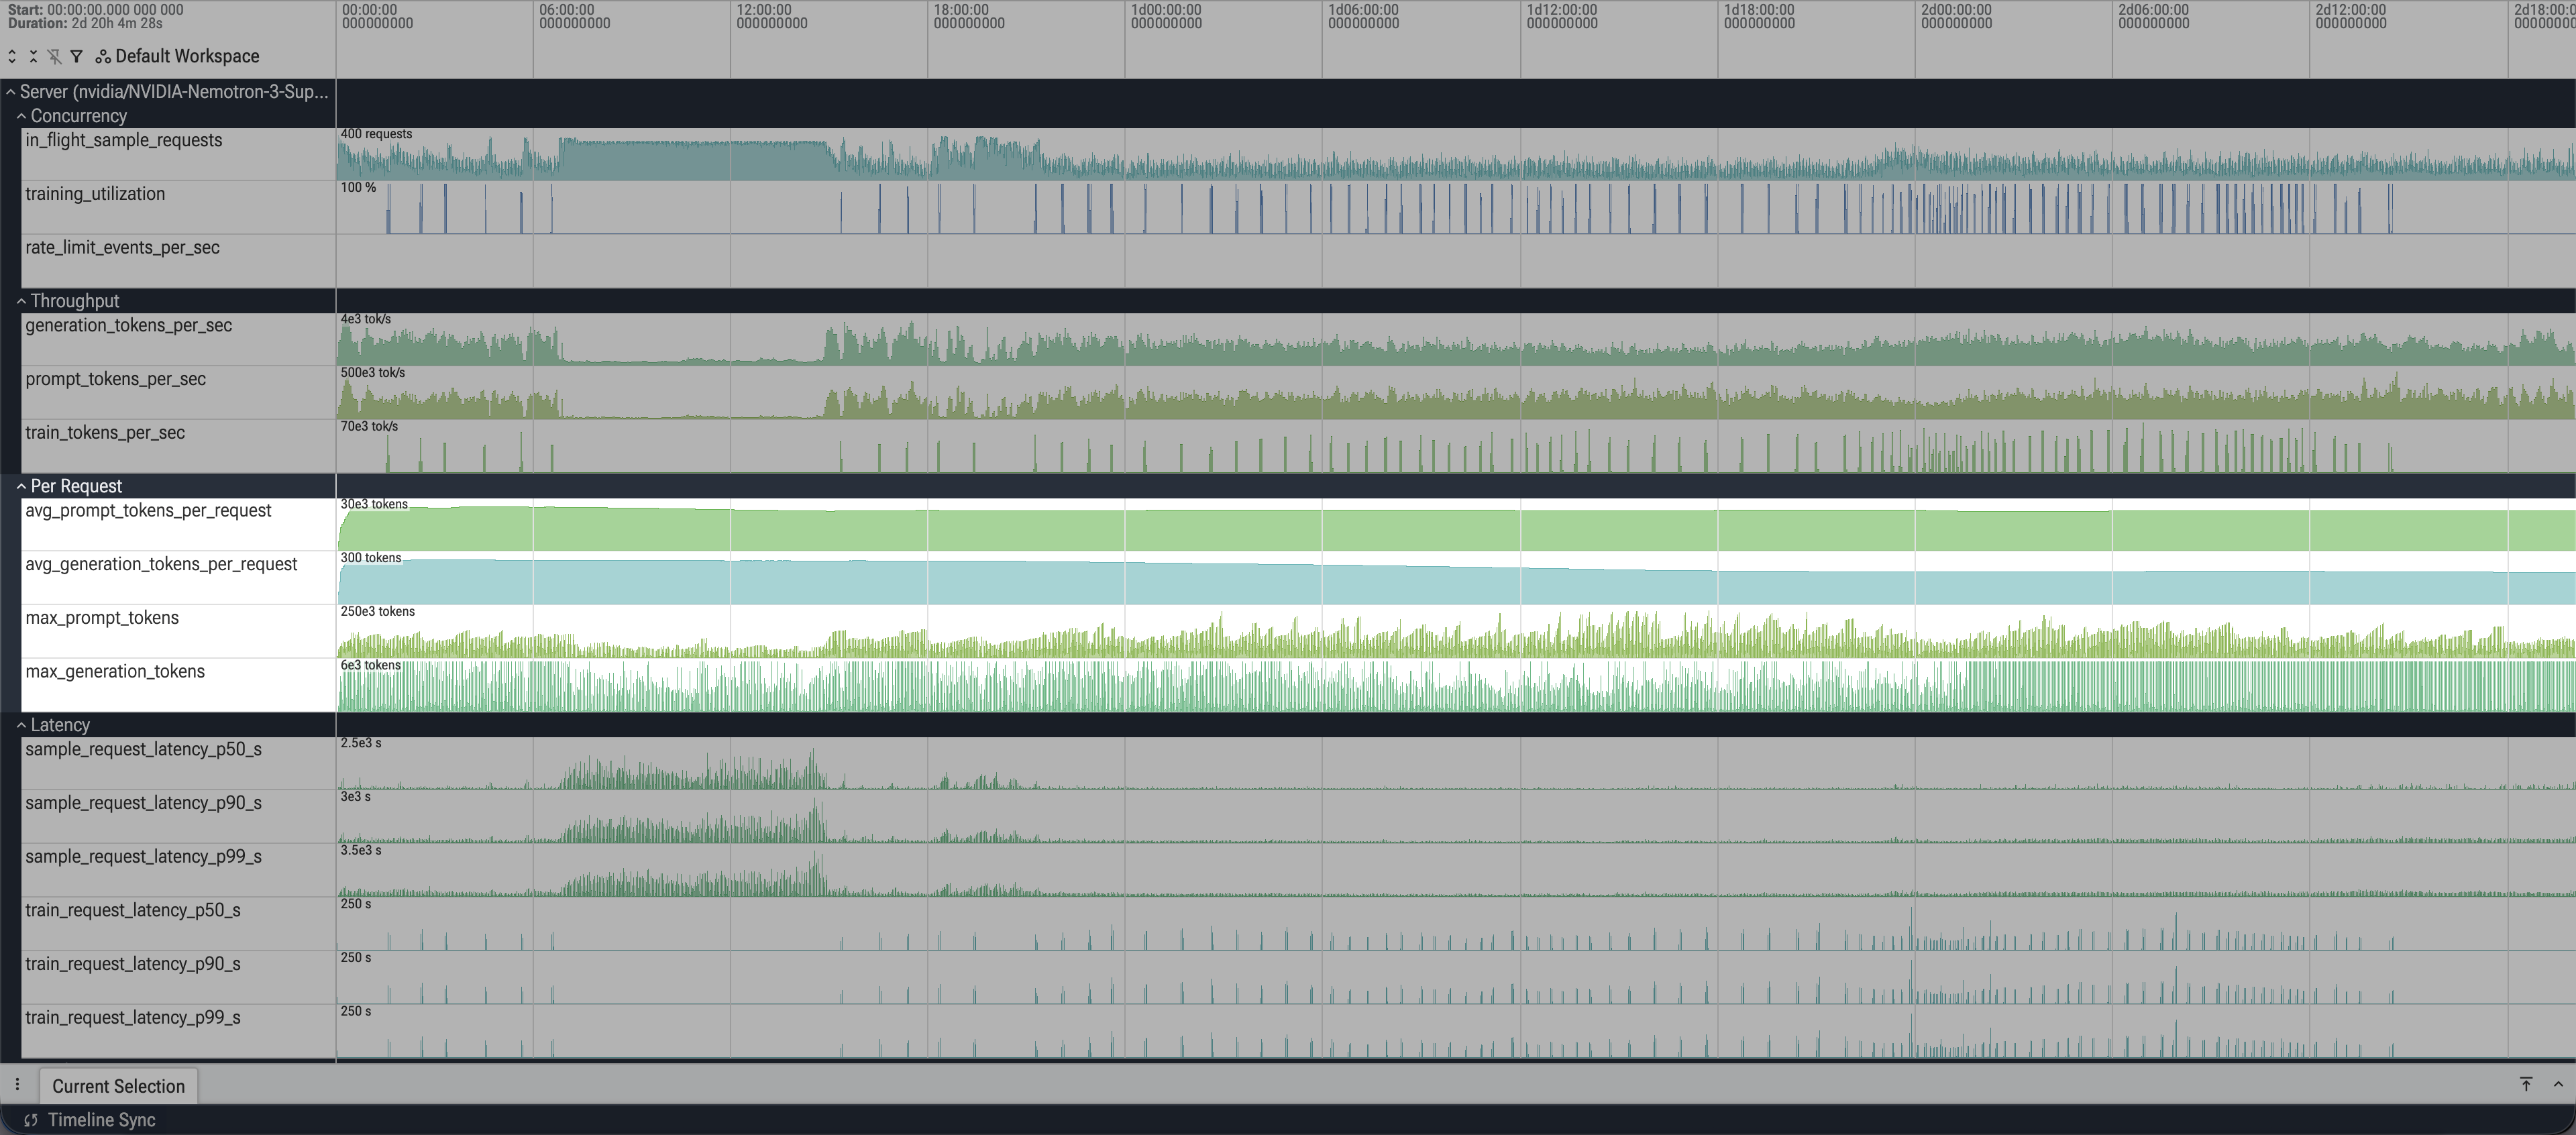
The Per Request counter tracks
Latency
- Sample request latency p50/p90/p99 (
s): sampling request time at each percentile, per 1-second interval. - Train request latency p50/p90/p99 (
s): same for training requests.
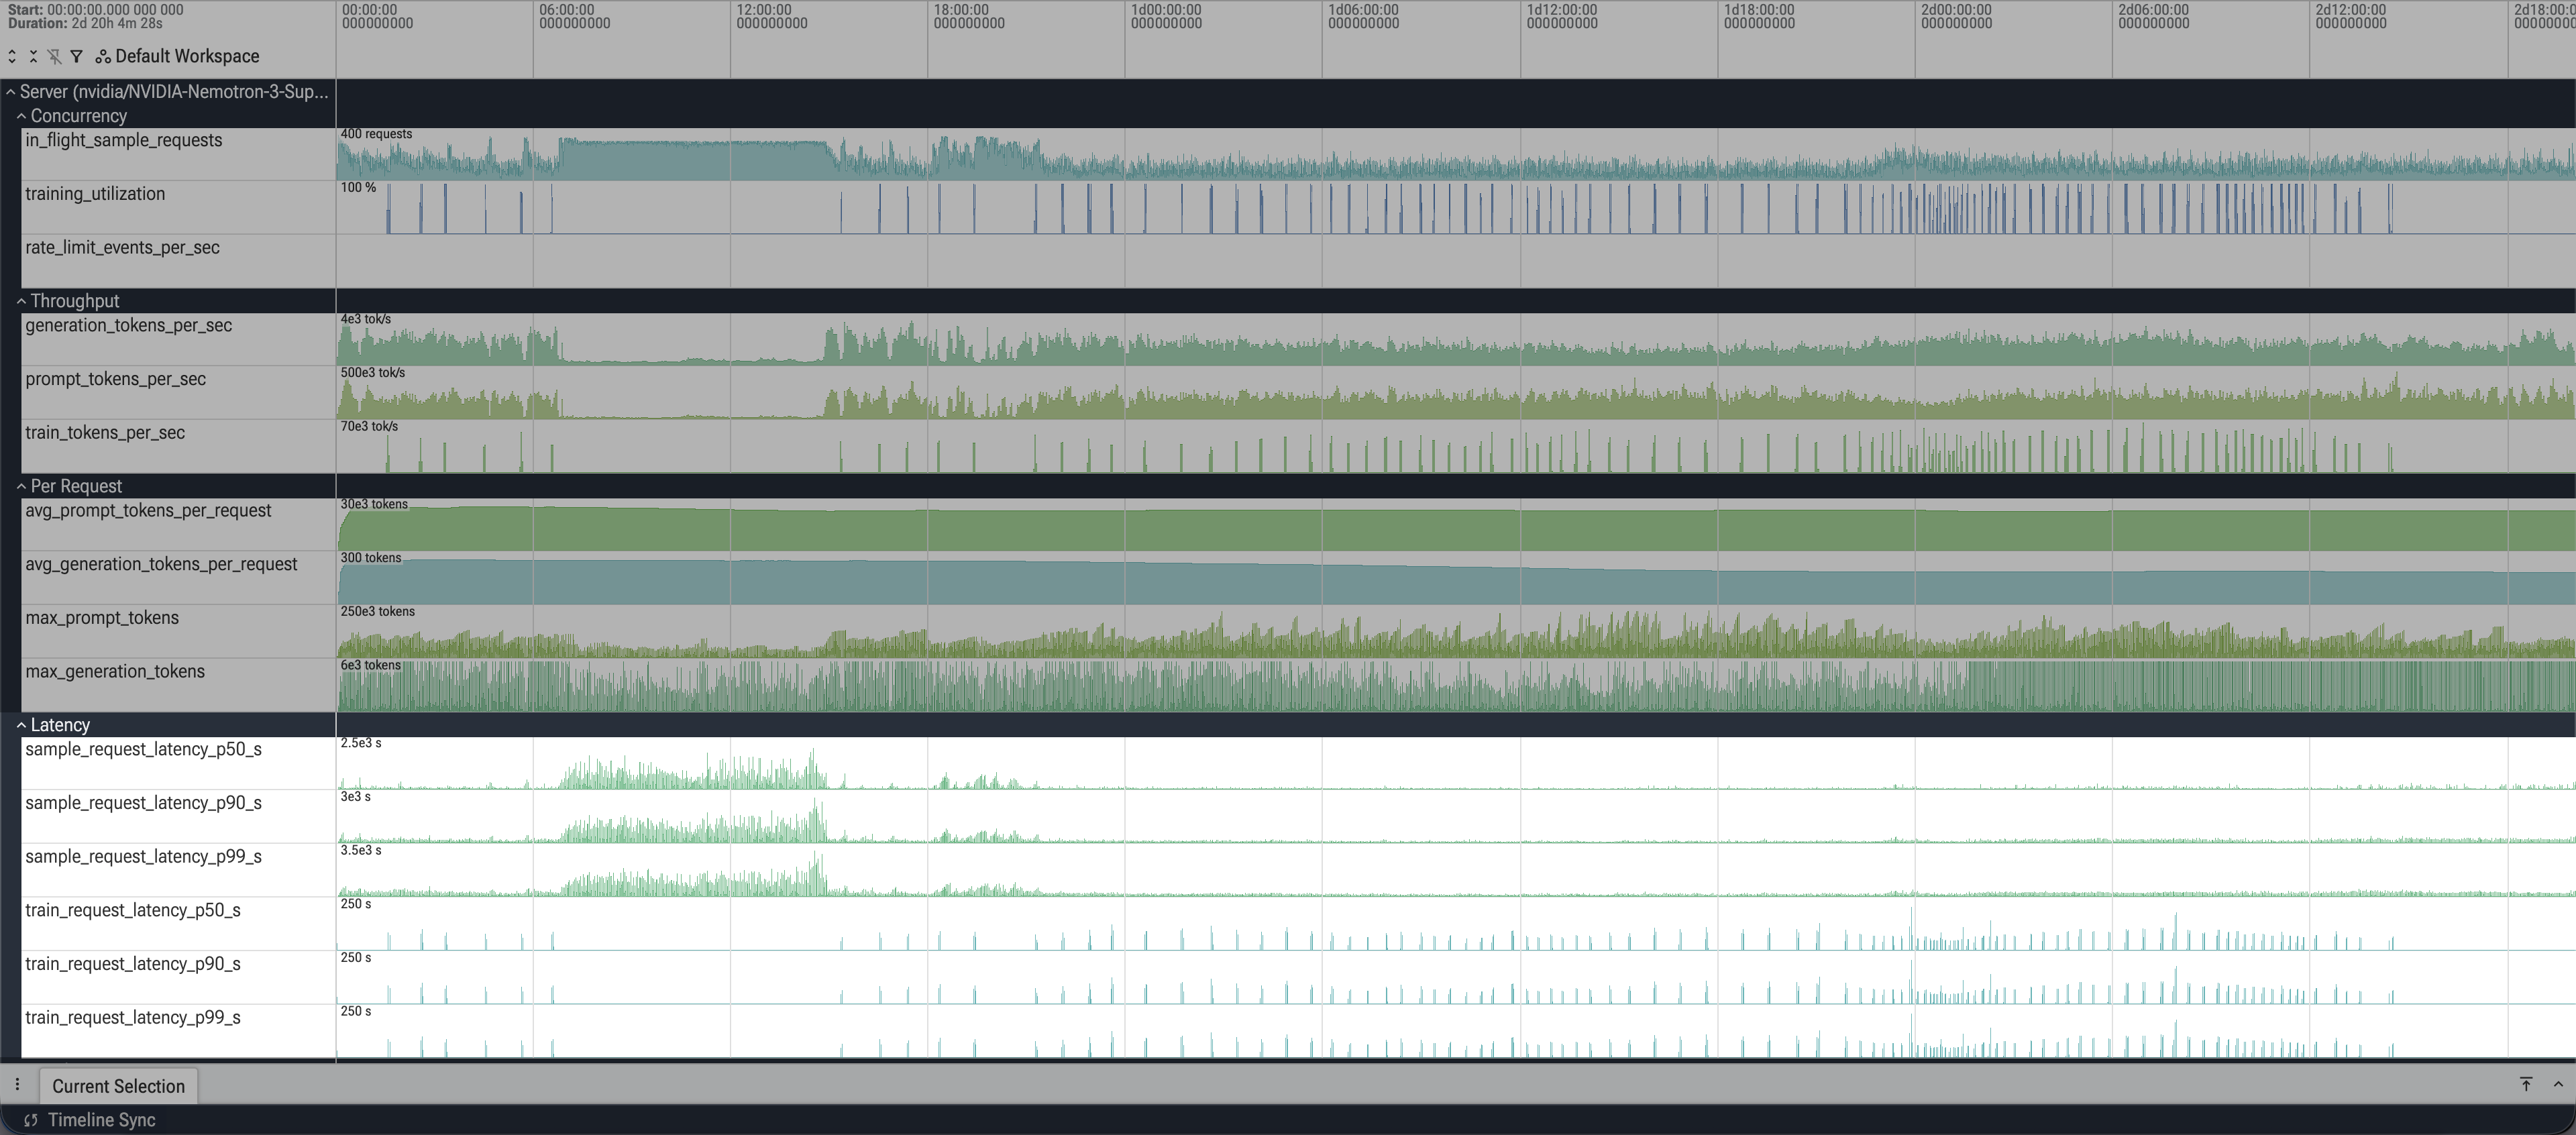
The Latency counter tracks
Totals
- Total completed samples (
samples): running total of finished sampling requests. - Total generation / prompt / train tokens (
tokens): cumulative tokens generated, prompted, and trained on.
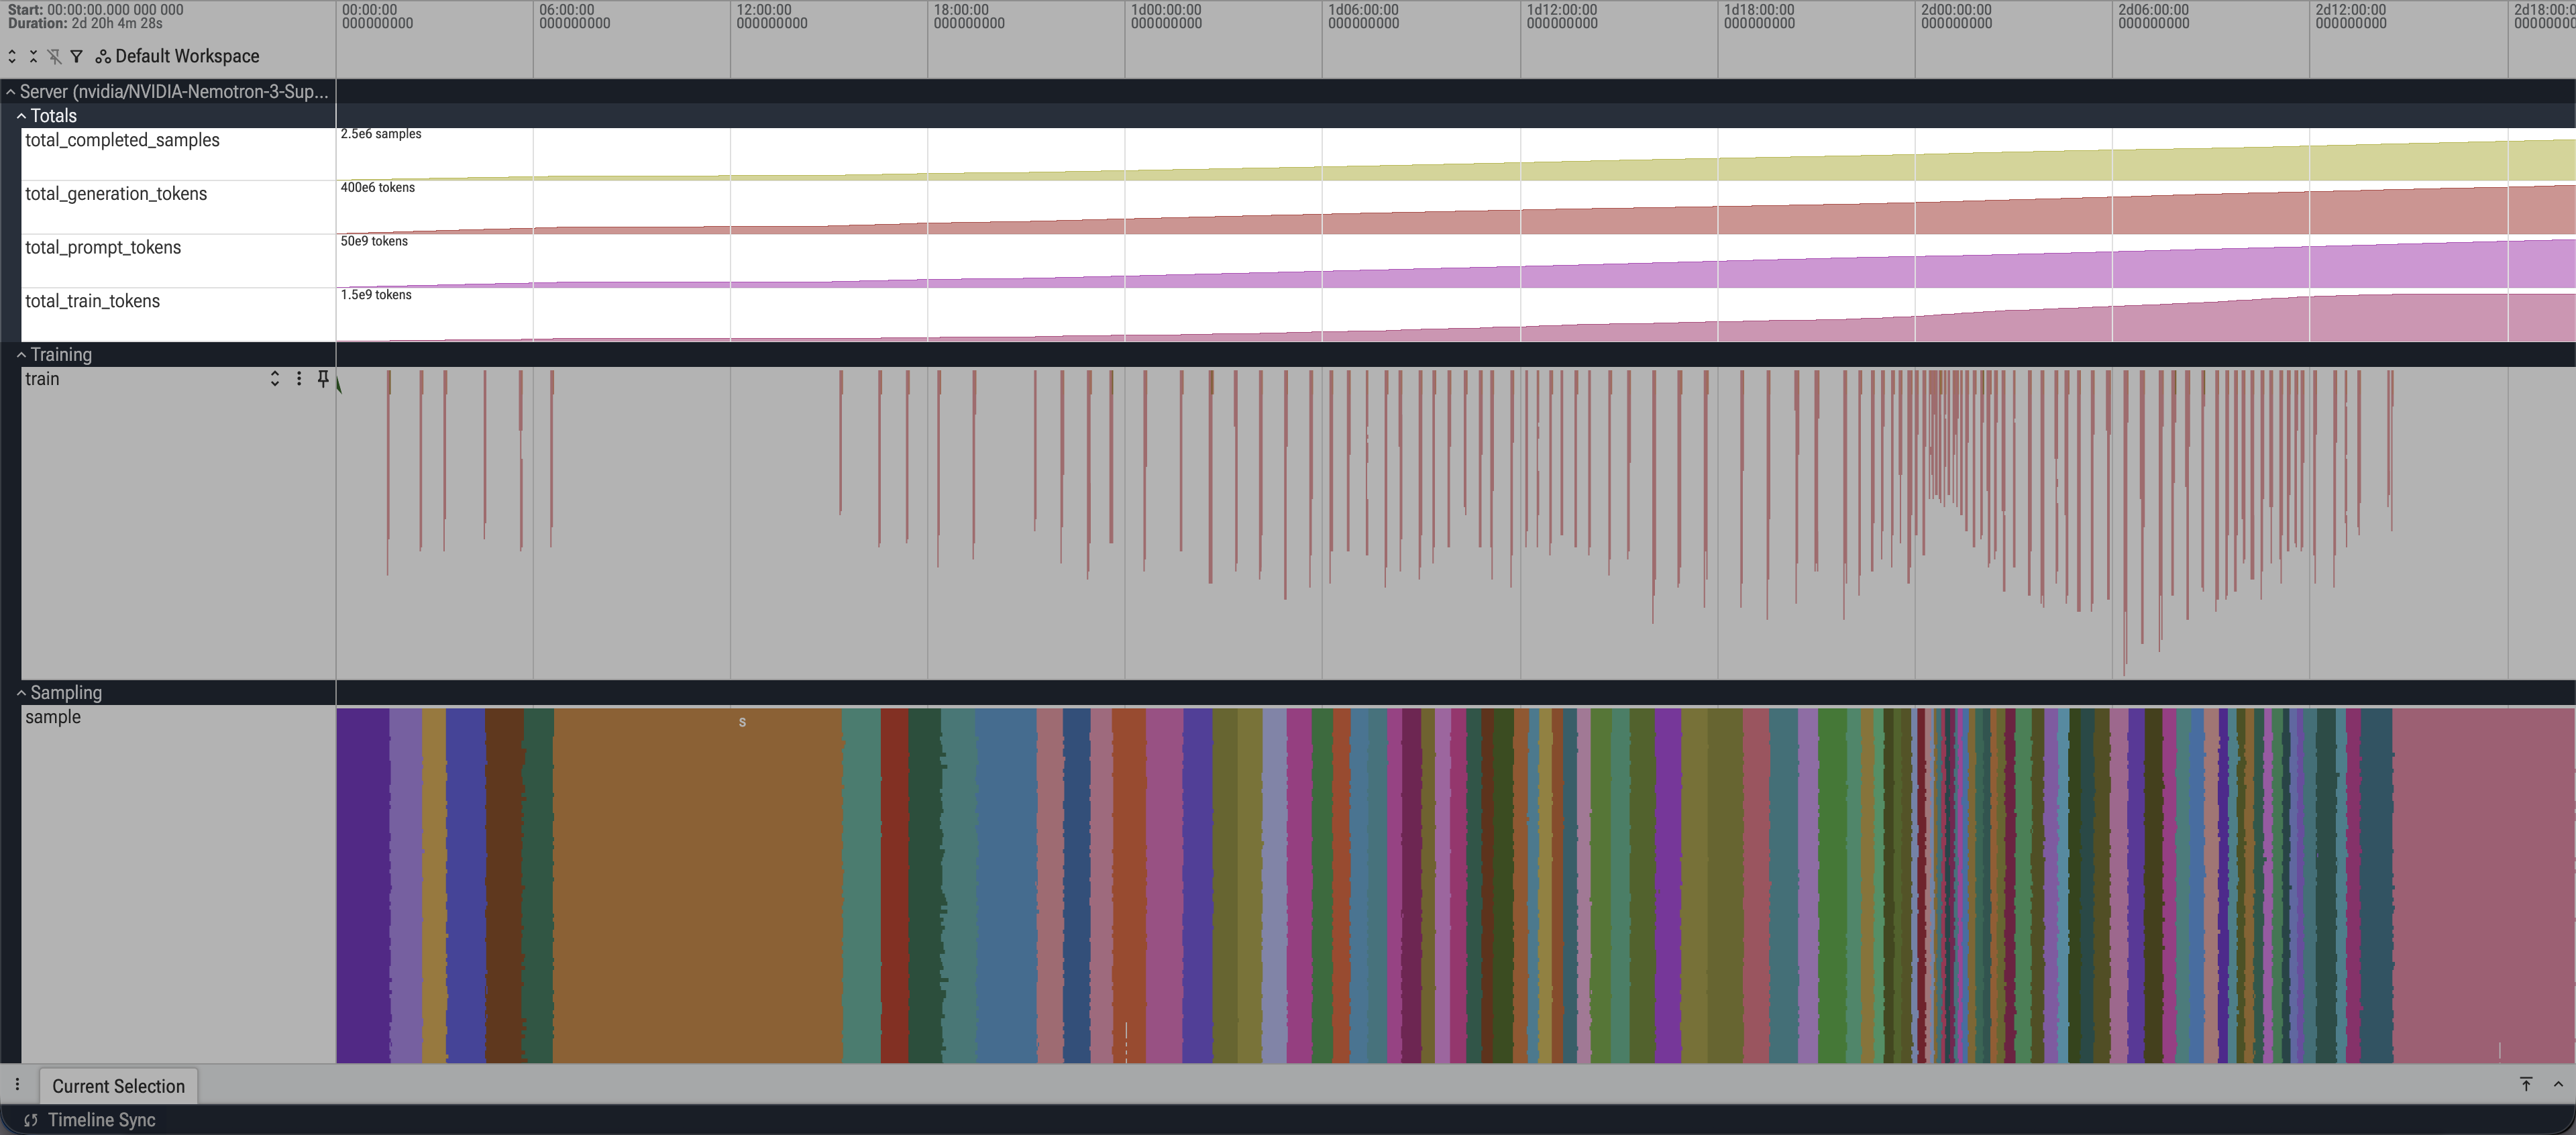
The Totals counter tracks
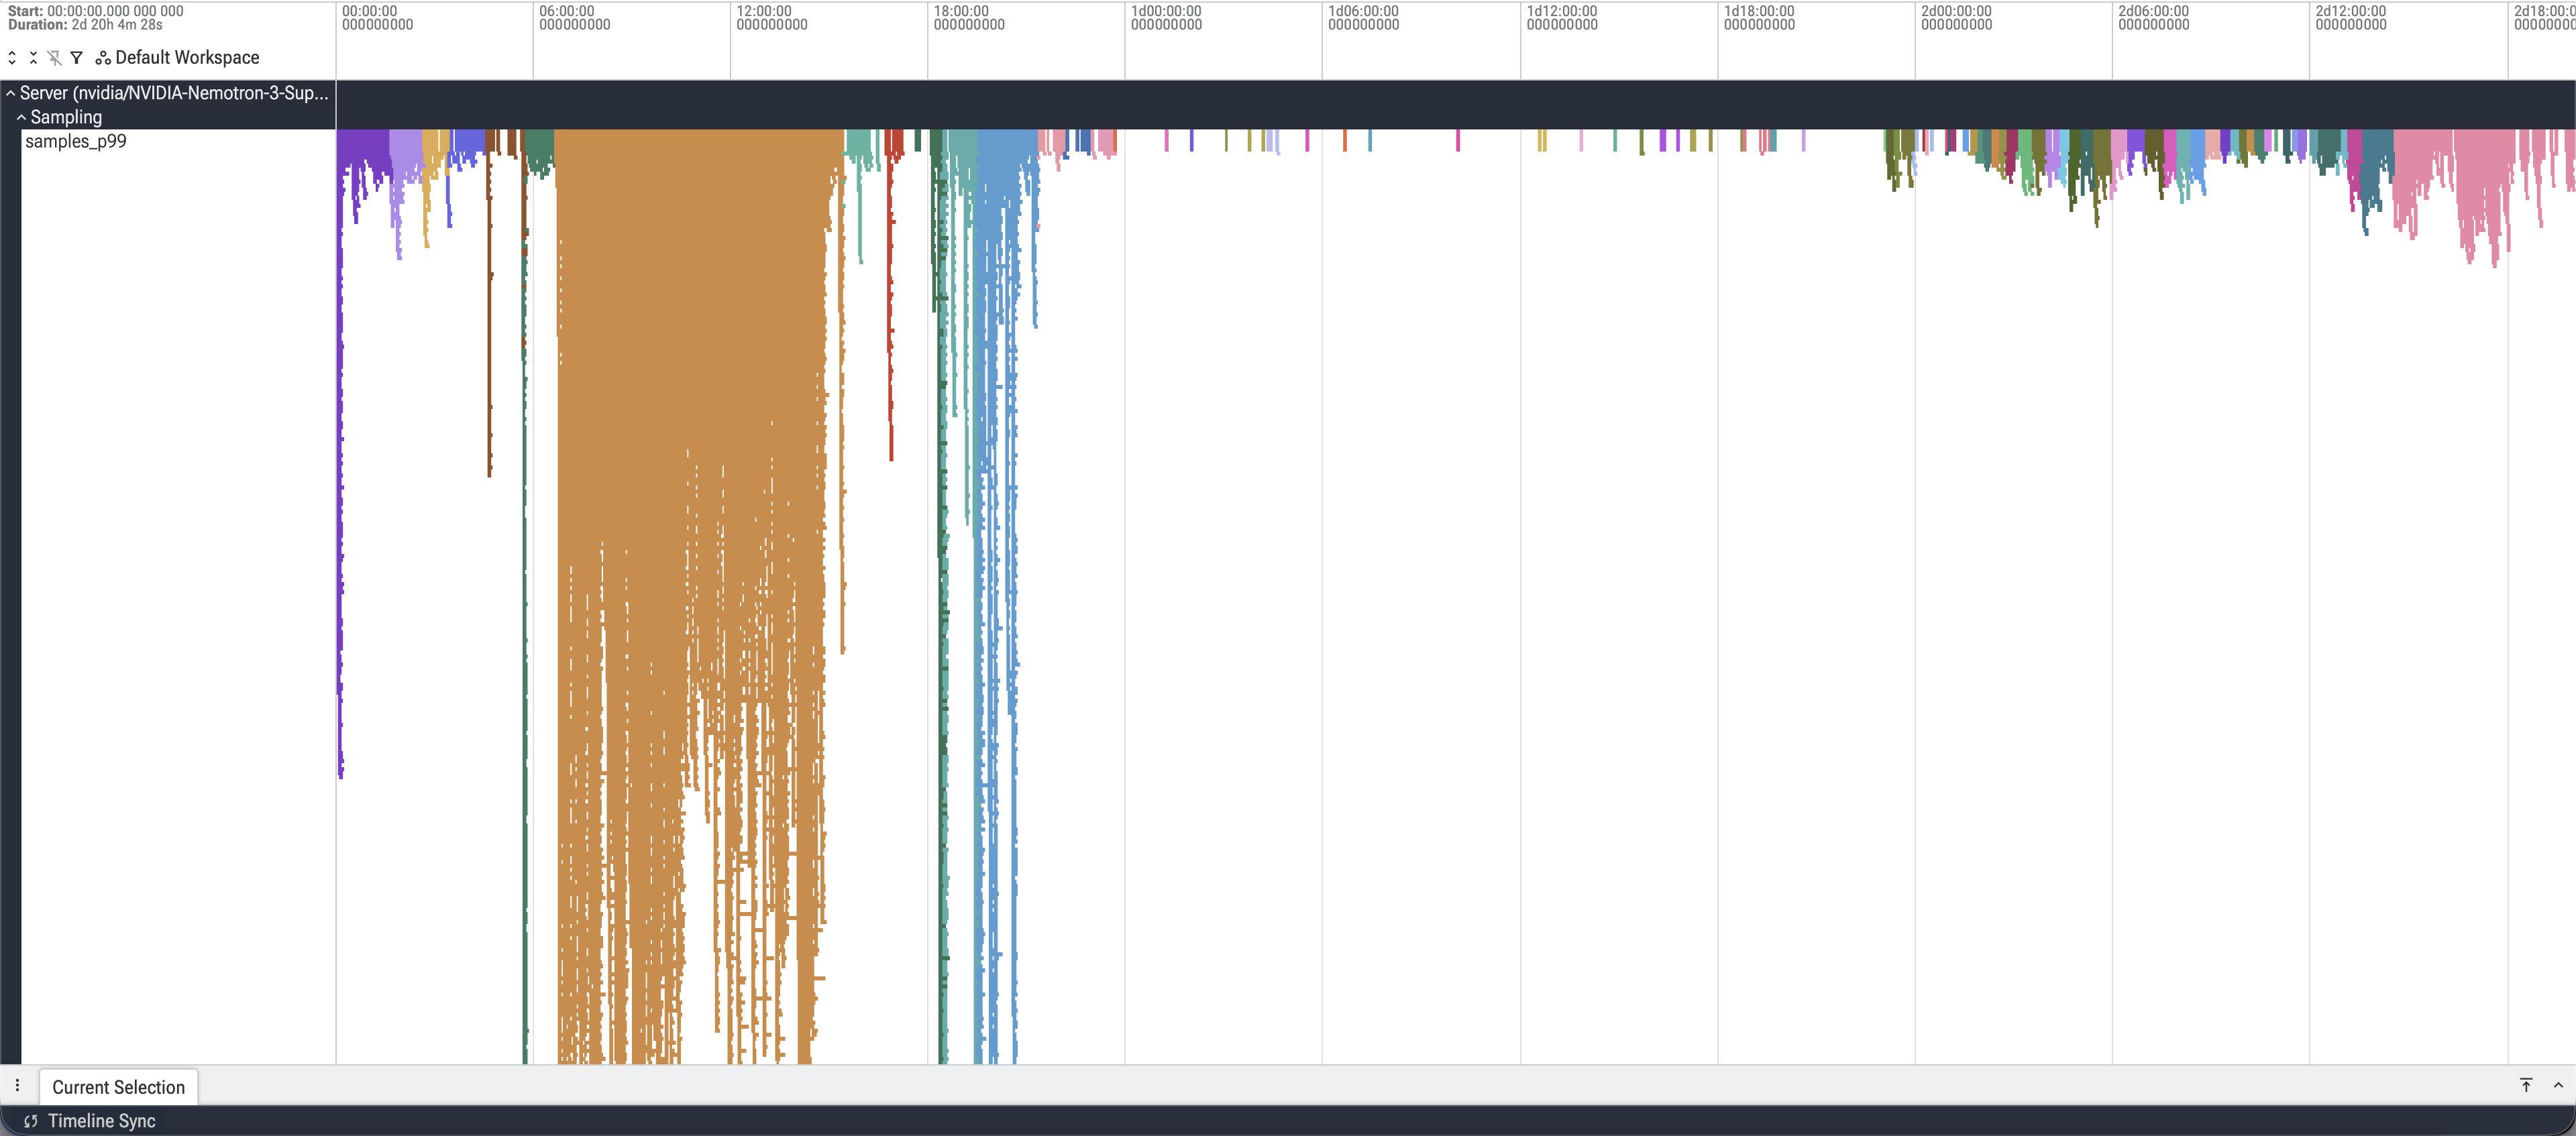
Per-request spans
Below the counters, each training and sampling request is its own slice on a lane, plus p90/p95/p99 rows that isolate the longest-running samples by span length so the slowest requests stand out. Click one for its timing and to see how requests overlapped; sampling slices are colored by weights version (matching Active sample requests).
Per-request sample spans
Example insights
- Async RL is working. Sample request spans overlap heavily with little gap between them, so new requests start before earlier ones finish. That overlap is the goal: the sampler stays busy instead of idling between steps.
- Higher concurrency lifts throughput. In the second half of this trace, In-flight sample requests and Generation tokens/sec track each other: concurrency rising from about 80 to 110 requests lifts throughput from roughly 1,500 to 1,900 tokens/sec.
- High concurrency with low throughput points to a backend issue. When In-flight sample requests spikes early and stays high while Generation tokens/sec and Prefill (prompt) tokens/sec stay low, requests are piling up faster than they get served. That points to a Tinker backend bottleneck rather than your code, so email us at [email protected] with your session ID and what you're seeing.
Tips
- Re-export to refresh. Downloading again picks up new activity; if nothing changed, you get the existing trace back instantly.
- Panels for a glance, trace for a deep dive. Panels for a quick read; the trace to inspect individual requests or correlate a dip with what was running.